
Statistical Inference: Hypothesis Testing Steps and Examples
- sujonodamario

- Apr 21, 2021
- 2 min read
Hypothesis Testing is a decision-making procedure in statistics with goal to whether accept or reject the null hypothesis (H0). According to Applied Statistics and Probability for Engineers (Montgomery & Runger, 2003), Hypothesis Testing consists of 8 main steps:
Identify the parameter that needs to be tested
State the null Hypothesis (H0)
Determine the alternative hypothesis (H1)
Choose a significant level (α)
Determine the statistic test
State the rejection region
Compute the value from statistic test
Decide whether to accept or reject the null Hypothesis
To fully understand these steps, we give a simple example of hypothesis testing on the mean of data. A retail store manager wants to know whether her latest marking campaign affects their average daily sales. She has the target of making 50 thousand Euro in revenue after the campaign.
Based on her data, the standard deviation of sales is two thousand and she specifies the significance level of 5% and selects 25 random historical samples with the mean of 51 thousand sales. This problem can be solved using hypothesis testing and apply its 8-step procedures.
Identify the parameter that needs to be tested
The parameter is average daily sales μ
State the null Hypothesis (H0)
The null hypothesis (H0) μ = 50.000
Determine the alternative hypothesis (H1)
The alternative hypothesis (H1) μ ≠ 50.000
Choose a significant level (α)
α = 0.05
Determine the statistic test
The standardize mean statistic test is based on standard normal distribution with the following formula:

State the rejection region
Significance level 5% means that the boundaries of critical regions are at 𝑧0.025 = 1.96 and −𝑧0.025 = −1.96. Thus, H0 will be rejected if 𝑍0 > 1.96 or 𝑍0 < −1.96
Compute the value from statistic test
With 𝑋̅ = 51.000 and 𝜎 = 2.000, then:
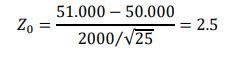
Decide whether to accept or reject the null Hypothesis
Because 𝑍0 is higher than 1.96, then we reject H0 of μ = 50.000 at 5% significance level. In other words, the sales are statistically different than her target of 50.000 Euro and therefore the marketing campaign affects their daily sales. Moreover, this test shows indication that the mean is higher than the target she previously set.


Comments